Rent vs. Buy in 2026: How Mortgage Rates Change the Math
Elevated mortgage rates fundamentally alter the classic rent versus buy equation. Learn how unrecoverable housing costs and investment opportunity costs shape the math.
Rent vs. Buy in 2026: How Mortgage Rates Change the Math
The decision to buy a home or continue renting is one of the most consequential personal finance choices an individual or household will ever make. Historically, conventional wisdom in the United States promoted homeownership as an unquestioned financial milestone, framing rent payments as "throwing money away."
However, when 30-year fixed mortgage rates remain elevated alongside firm home prices—as reflected in real estate and housing market benchmarking as of September 2026—the financial math governing rent versus buy calculations shifts significantly. Neither renting nor buying is universally superior; the optimal choice depends on unrecoverable housing costs, investment opportunity costs, local price-to-rent ratios, tax deduction rules, and planned time horizons.
1. The Concept of Unrecoverable Costs
A common analytical error in housing discussions is comparing total monthly rent directly against a monthly mortgage payment. A mathematically sound comparison evaluates unrecoverable costs on both sides of the equation.
Unrecoverable costs are expenses that do not build equity or return principal to your balance sheet.
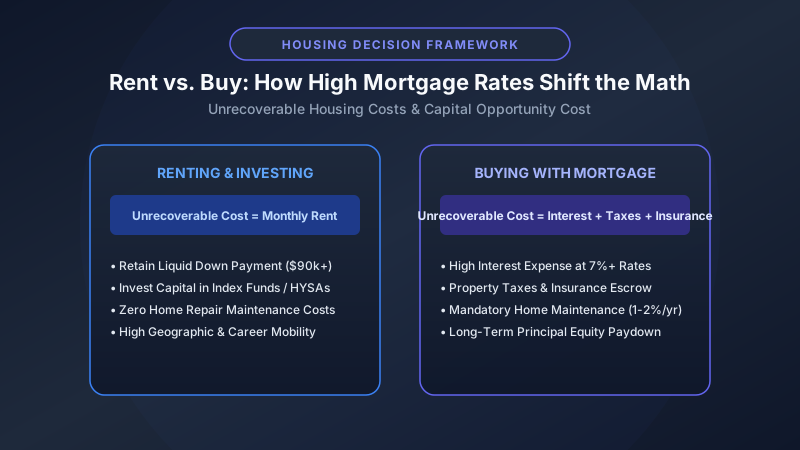
Unrecoverable Cost of Renting  = Monthly Rent Payment
Unrecoverable Cost of Buying   = Mortgage Interest + Property Taxes + Homeowners Insurance + Maintenance + HOA Fees + Opportunity Cost of Down Payment
           Monthly Outflow Comparison
┌───────────────────────────┬───────────────────────────┐
│         RENTING           │          BUYING           │
├───────────────────────────┼───────────────────────────┤
│ • Pure Rent (Unrecoverable)│ • Mortgage Interest       │
│                           │ • Property Taxes          │
│                           │ • Home Insurance & HOA    │
│                           │ • Home Maintenance (1-2%) │
│                           │ • Equity Principal Paydown│
└───────────────────────────┴───────────────────────────┘
When mortgage interest rates are high, the interest portion of a mortgage payment in early loan years represents an overwhelmingly large unrecoverable cost, often exceeding equivalent local rent for comparable properties.
2. Key Components of Homeownership Costs
To calculate the true cost of homeownership, buyers must look far beyond Principal & Interest:
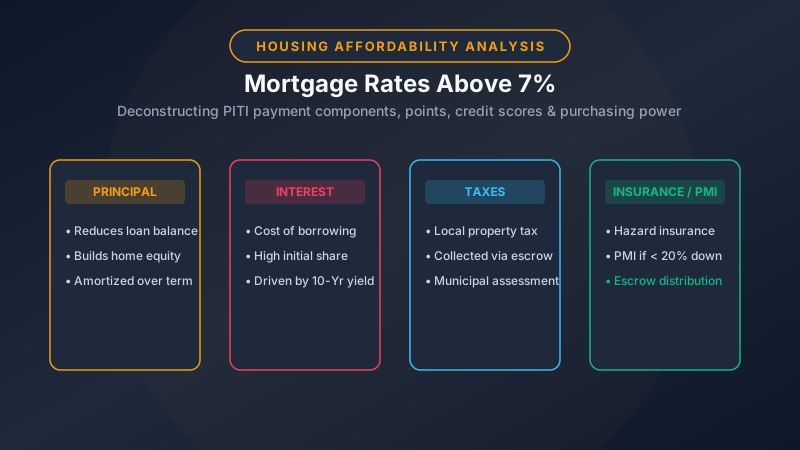
- Mortgage Interest: The cost paid to the lender for capital. At a 7% interest rate, the vast majority of payments during the first 10 years are unrecoverable interest. Review key payment details in our guide on mortgage rates above 7 percent.
- Property Taxes: Municipal taxes assessed on property value. Property taxes do not build equity and generally increase over time.
- Homeowners Insurance & PMI: Insurance coverage protecting property structure and liability. If putting down under 20%, mandatory private mortgage insurance (PMI) adds further unrecoverable cost.
- Maintenance & Repairs: As a general baseline, physical maintenance and long-term capital replacements (roof, HVAC, plumbing) average 1% to 2% of the home's value annually.
- Closing Costs: Transaction costs paid when buying (2% to 5% of purchase price) and selling (5% to 6% agent commissions and transfer taxes).
3. Tax Deductions: Standard Deduction vs. Itemizing
A traditional argument for homeownership is the ability to deduct mortgage interest and property taxes from federal income taxes. However, tax rule changes under the Tax Cuts and Jobs Act (TCJA) altered this calculation for many middle-income households:
- High Standard Deduction: Because the federal standard deduction is high ($15,000+ for single filers, $30,000+ for married filing jointly), many homeowners do not generate enough total itemized deductions to exceed the standard deduction threshold.
- SALT Cap Limit: State and Local Tax (SALT) deductions—which include local property taxes—are capped at a maximum of $10,000 annually.
- Net Tax Savings: If a homeowner's total itemized deductions (mortgage interest + SALT) only slightly exceed the standard deduction, the net tax benefit of homeownership is minimal.
4. Opportunity Cost of Capital
A critical factor frequently omitted from simple housing calculators is the opportunity cost of down payment capital.
Buying a $450,000 home with a 20% down payment requires locking up $90,000 in cash, plus approximately $15,000 in closing costs ($105,000 total initial capital).
- Homeowner Path: That $105,000 is illiquid equity tied up in real estate.
- Renter Path: A renter retains that $105,000 in liquid capital, which can be invested in a diversified portfolio (such as broad market index funds inside a taxable brokerage account or yield-generating cash accounts).
If invested capital earns an average annual return of 7% to 8%, the compound investment growth foregone by putting that cash into real estate represents a real financial opportunity cost that must be factored into the comparison.
5. Hypothetical 7-Year Rent vs. Buy Scenario
To examine how these financial variables operate in practice, consider the following hypothetical 7-year comparative model.
- Target Property Value: $400,000
- Down Payment: 20% ($80,000) | Loan Amount: $320,000 at 7.00% 30-Year Fixed
- Alternative Monthly Rent for Equivalent Property: $2,200/month (increasing 3% annually)
- Assumed Home Appreciation: 3% per year | Assumed Investment Return on Renter Savings: 7% per year
(Note: Figures are simplified estimates for illustrative purposes; local tax rules and market performance vary.)
| Financial Variable | Buying Path (7 Years) | Renting Path (7 Years) |
|---|---|---|
| Initial Upfront Capital Required | $92,000 (Down Payment + Closing) | $4,400 (Deposit + First Month) |
| Total Monthly Outflows Over 7 Years | ~$248,000 (PITI + Maint + HOA) | ~$202,000 (Total Rent Paid) |
| Equity Built via Principal Paydown | $28,400 | $0 |
| Estimated Property Value at Year 7 | $491,900 (+3%/yr) | N/A |
| Selling Costs at Year 7 (6%) | -$29,500 | $0 |
| Growth of Initial Saved Capital ($87,600 diff) | $0 (Tied in Home) | ~$140,600 (Invested at 7%) |
| Estimated Net Financial Position | +$110,800 | +$140,600 |
In this specific hypothetical scenario, elevated mortgage interest costs and selling commissions cause the renting and investing path to yield a higher net financial position over a 7-year timeline. However, extending the holding timeline to 15 or 20 years or assuming higher property appreciation rates can reverse the outcome in favor of homeownership.
6. The Rent-to-Price Ratio and Location Dynamics
Housing markets vary drastically by geographic location. Real estate analysts evaluate the Price-to-Rent Ratio to gauge local market bias:
Price-to-Rent Ratio = Median Home Purchase Price / Annual Rent for Equivalent Property
- Price-to-Rent Ratio < 15: Indicates home purchase prices are relatively low compared to rents, favoring homeownership.
- Price-to-Rent Ratio > 21: Indicates home purchase prices are elevated relative to rents (common in high-cost coastal metropolitan areas), heavily favoring renting and investing the difference.
7. Non-Financial Qualitative Factors
While financial math provides objective guidance, qualitative personal factors often play a decisive role in housing decisions:
| Housing Path | Key Qualitative Advantages | Key Qualitative Disadvantages |
|---|---|---|
| Buying | Total control over property modifications, permanent housing stability, psychological security | Illiquid wealth concentration, responsibility for all repairs, physical location lock-in |
| Renting | Maximum career & geographic mobility, zero repair responsibilities, predictable fixed monthly outlay | Lease non-renewal risk, landlord property rules, rent price increases at lease renewal |
Practical Decision Framework
- Calculate Planned Tenure: If you plan to remain in a home for less than 5 to 7 years, high upfront transaction costs and early mortgage interest make renting statistically more favorable.
- Audit Total Unrecoverable Costs: Compare local rent against mortgage interest, taxes, insurance, maintenance, and lost investment returns.
- Maintain Emergency Liquidity: Never exhaust your total cash reserves for a down payment. Ensure adequate liquidity, as outlined in emergency fund amount explained.
8. Geographic Relocation & Price-to-Rent Ratios
When evaluating whether to rent or buy, location dynamics often dictate the financial outcome. Real estate markets across the United States exhibit vastly different Price-to-Rent ratios:
- High Price-to-Rent Markets (Ratios > 22): In high-cost coastal metropolitan areas (e.g., San Francisco, New York, Seattle), purchasing a median home requires substantial capital outlay and monthly mortgage payments that far exceed local rent rates for comparable housing. Renting and investing the monthly cost difference frequently generates superior long-term wealth accumulation.
- Low Price-to-Rent Markets (Ratios < 14): In heartland or mid-sized metropolitan areas, home purchase prices are lower relative to rental rates. In these markets, unrecoverable mortgage interest and tax costs are lower, favoring homeownership even at higher interest rates.
Auditing local Price-to-Rent metrics before making relocation decisions ensures your housing choices align with long-term financial goals.
MoneyTalkin' provides financial education, educational concepts, and general informational guides. Articles do not constitute personalized financial, investment, legal, or tax advice. Financial products, rates, terms, and regulatory rules change frequently; consult a qualified financial professional regarding your specific situation. Read our full Disclaimer Policy.
Written by MoneyTalkin'
MoneyTalkin' researches and publishes objective financial education content, money management fundamentals, and practical financial guides.
Related Technical Articles
Explore related topics in this cluster to deepen your understanding.