What's Left of the NFT Market After the Downturn? Who Is Still Building?
A factual, data-grounded review of the post-boom NFT ecosystem, contrasting 90%+ secondary volume declines with ongoing protocol, gaming, and ticketing infrastructure.
What's Left of the NFT Market After the Downturn? Who Is Still Building?
Between 2021 and early 2022, non-fungible tokens (NFTs) experienced one of the most rapid speculative expansions in modern digital asset history. Driven by high-profile picture (PFP) sales, celebrity endorsements, and speculative secondary market liquidity, monthly trading volume across major NFT marketplaces surpassed billions of dollars.
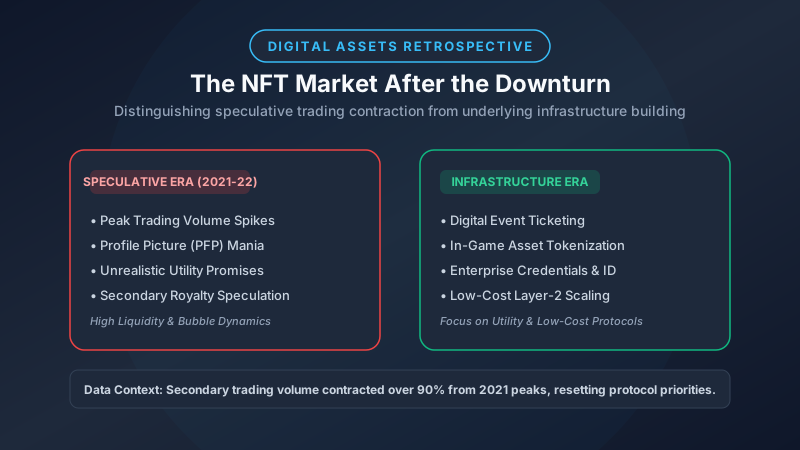
By 2023 and continuing into subsequent market cycles, however, the speculative boom contracted sharply. Secondary trading volume dropped by over 90% from peak levels, floor prices for popular digital collections declined significantly, and speculative retail interest waned.
Rather than declaring the technology universally "dead" or predicting an inevitable speculative resurgence, this article provides a factual, data-grounded evaluation of the post-downturn NFT ecosystem: what contracted, what survived, and where active development continues across digital infrastructure.
1. The Scale of the Market Contraction
To analyze the current landscape, it is necessary to examine documented market contraction data:
Volume & Valuation Metrics
- Secondary Trading Volume: On-chain analytics indicate that monthly NFT trading volume across major platforms (such as OpenSea, Blur, and Magic Eden) fell from over $4 billion per month at early 2022 peaks to under $300 million during post-downturn consolidation periods.
- Floor Price Depreciation: The minimum asking price ("floor price") for flagship PFP collections declined 70% to 95% measured in underlying crypto assets (ETH or SOL), with steeper dollar-denominated declines occurring during broader digital asset bear markets.
- Royalty Revenue Collapse: Optional royalty enforcement implemented by competing marketplace platforms reduced creator royalty revenues by over 80%, disrupting early business models that relied on recurring secondary transaction fees.
2021-2022 Peak Volume ($4B+/mo) -> 90%+ Volume Contraction -> Protocol Consolidation & Utility Pivot
2. What Failed: Speculative Drivers
The market downturn exposed several fragile assumptions that characterized the early NFT boom:
- Purely Speculative Valuation Models: Many early projects relied on greater fool theory—the assumption that someone else would pay a higher price tomorrow for a digital image without underlying cash flow or legal rights.
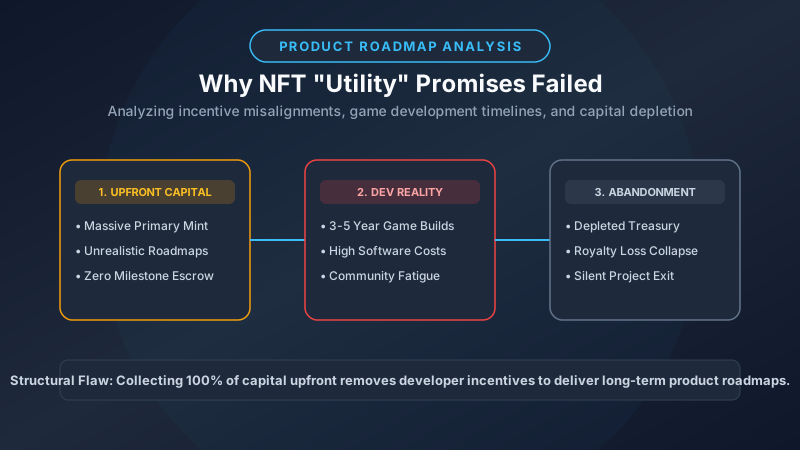
- Over-Promised Roadmap Utility: As detailed in our breakdown of why NFT utility failed, hundreds of projects launched with ambitious roadmaps (e.g., metaverse worlds, play-to-earn games, exclusive physical clubs) that teams lacked the capital or technical capability to build.
- High Gas & Transaction Friction: Executing transactions directly on Ethereum Layer-1 during peak congestion required paying $50 to $100+ in gas fees per transaction, making low-cost digital items economically unviable.
3. Who Is Still Building: Active Use Cases
Despite the contraction in speculative secondary trading, protocol developers, enterprise brands, and gaming studios continue to build applications focused on utility rather than asset speculation:
1. Low-Cost Layer-2 & Alternative Blockchain Infrastructure
Development has shifted heavily away from high-fee Layer-1 environments toward Layer-2 scaling networks (such as Arbitrum, Optimism, and Base) and alternative high-throughput blockchains (such as Solana and Polygon):
- Sub-Cent Transactions: Transaction fees on modern scaling networks cost fractions of a cent, allowing digital tokens to be minted and transferred seamlessly within mobile apps.
- Abstracted Wallets: Account abstraction (ERC-4337) allows users to interact with digital assets using standard email logins and social single-sign-on (SSO), eliminating the need to manage complex 12-word seed phrases manually.
2. Digital Ticketing & Attendance Proofs
Event organizers and venues are adopting digital tokens to replace legacy paper and PDF tickets:
- Anti-Scalping Controls: Smart contracts enable event organizers to cap secondary resale prices or collect transparent revenue shares on secondary ticket transfers.
- Proof of Attendance (POAPs): Conference organizers issue non-transferable digital badges to verify attendance, granting attendees access to follow-up educational materials or online communities.
3. In-Game Asset Ownership & Interoperability
Independent and web3 gaming studios are integrating digital tokens to represent in-game items:
- Player Ownership: Players can buy, sell, or trade in-game skins, weapons, and virtual land on open secondary marketplaces without relying on closed publisher ecosystems.
- Free-to-Play Integration: Modern gaming implementations obscure the underlying blockchain mechanics, treating digital tokens as standard backend inventory items.
4. Enterprise Brand Loyalty & Digital Collectibles
Major consumer brands have explored tokenized digital engagement models:
- Brand Loyalty Programs: Companies like Starbucks (Odyssey) and Nike (.Swoosh) experimented with digital stamps and virtual apparel tokens designed to incentivize consumer engagement and grant access to physical product drops.
- Streamlined Onboarding: Brands intentionally avoided jargon like "NFT" or "blockchain," framing programs around "digital collectibles" or "membership passes" backed by custodial mobile wallets.
5. Digital Identity & Domain Systems
Blockchain domain projects (such as ENS - Ethereum Name Service) allow users to map complex alphanumeric wallet addresses to human-readable names (e.g., name.eth):
- Cross-Platform Identity: Users utilize a single digital identity across decentralized social applications, messaging protocols, and financial platforms, providing functional domain routing rather than speculative art collecting.
4. The Creator Royalty War & Marketplace Shifts
A major structural shift during the downturn was the collapse of enforced creator royalties:
- Legacy Royalty Model (2021-2022): Early marketplaces enforced a 2.5% to 10% secondary sale royalty fee paid directly to the original creator on every trade.
- Zero-Royalty Marketplace Competition: Emerging trading platforms like Blur introduced optional royalties to undercut incumbents, capturing massive market share from OpenSea by prioritizing high-frequency trader liquidity over creator fees.
- Impact on Creator Business Models: As secondary royalties evaporated, Web3 projects could no longer rely on passive trading fees for long-term operational funding, forcing teams to adopt traditional SaaS subscription models or software licensing.
5. Speculation vs. Utility: The Shift in Industry Expectations
| Dimension | Speculative NFT Era (2021-2022) | Utility-Focused Era (Current) |
|---|---|---|
| Primary Incentive | Rapid capital appreciation / flipping | Practical access, identity, or digital ownership |
| Asset Type | High-value profile pictures (PFPs) & digital art | Tickets, gaming items, domain names, credentials |
| Transaction Cost | High ($20-$100+ gas fees) | Negligible (sub-cent Layer-2 execution) |
| User Experience | Complex wallet setups & seed phrase security | Account abstraction, email login, social auth |
| Target Audience | Crypto-native speculators & collectors | General consumers, gamers, event attendees |
5. Tax & Legal Realities in the Post-Downturn Market
As the market matured, regulatory oversight clarified tax obligations surrounding digital assets:
- IRS Tax Reporting: In the United States, selling an NFT for profit triggers capital gains tax obligations, while realized losses can be offset against gains as outlined in our guide to NFT taxes explained.
- Intellectual Property Rights: Courts and legal experts have clarified that buying an NFT transfers on-chain token ownership, but does not automatically grant copyright or trademark ownership over the underlying artwork unless explicitly transferred by contract, as explored in NFTs beyond art explained.
6. Strategic Summary for Observers
The contraction of the 2021–2022 NFT bubble highlights a classic technology adoption curve pattern (the Gartner Hype Cycle):
- Peak of Inflated Expectations: Speculative price spikes detached from real-world utility.
- Trough of Disillusionment: 90%+ trading volume decline and project abandonment.
- Slope of Enlightenment: Quiet, persistent development focused on scaling infrastructure, low-cost user experiences, and functional enterprise integration.
For market participants analyzing digital assets or economic concepts like digital scarcity, recognizing the distinction between speculative trading volume and foundational technology infrastructure provides essential perspective.
MoneyTalkin' provides financial education, educational concepts, and general informational guides. Articles do not constitute personalized financial, investment, legal, or tax advice. Financial products, rates, terms, and regulatory rules change frequently; consult a qualified financial professional regarding your specific situation. Read our full Disclaimer Policy.
Written by MoneyTalkin'
MoneyTalkin' researches and publishes objective financial education content, money management fundamentals, and practical financial guides.
Related Technical Articles
Explore related topics in this cluster to deepen your understanding.