Bitcoin and Interest Rates: Why Monetary Policy Can Matter to Crypto Prices
While Bitcoin was designed as a decentralized currency, its market price is influenced by global liquidity, central bank interest rates, and investor risk appetite.
Bitcoin and Interest Rates: Why Monetary Policy Can Matter to Crypto Prices
Bitcoin (BTC) was created in 2009 following the global financial crisis as a peer-to-peer electronic cash system featuring a cryptographically enforced, finite supply cap of 21 million coins. Proponents often describe Bitcoin as digital gold or an independent monetary network immune to central bank money printing.
However, as Bitcoin's market capitalization expanded and institutional participation grew—as documented in crypto market trading records as of September 2026—its secondary market price has exhibited strong sensitivity to global macroeconomic conditions, Federal Reserve interest rate policy, and broader market liquidity cycles. Understanding the financial mechanisms connecting interest rates to digital asset valuations provides essential context for market observers.
1. The Macro Liquidity Framework: Risk-On vs. Risk-Off
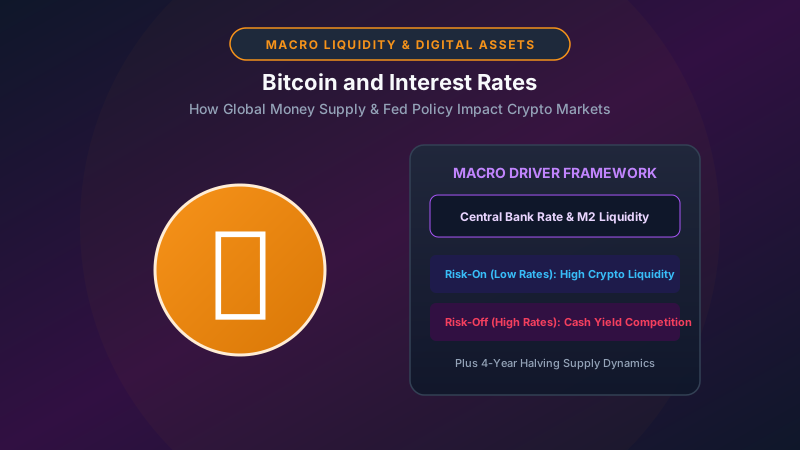
While Bitcoin's underlying protocol operates independently of central banks, the capital used to purchase digital assets originates within the global financial system. Consequently, central bank policy influences market liquidity and investor risk tolerance.
Low Interest Rates / Central Bank Expansion (Quantitative Easing)
                     │
                     ▼
High Global Liquidity ──► Investor Search for Yield ──► Capital Flows to Risk Assets (Tech & Crypto)
High Interest Rates / Central Bank Tightening (Quantitative Tightening)
                     │
                     ▼
Controlling Liquidity ──► High Risk-Free Cash Yields ──► Capital Allocates to Safe Assets
Risk-On Environments
When central banks maintain low benchmark interest rates and expand balance sheets, yields on safe cash assets (such as Treasury bills and savings deposits) remain low. Investors seeking higher potential returns move further out on the risk spectrum into growth stocks, venture capital, and digital assets (Risk-On mode).
Risk-Off Environments
When central banks raise benchmark interest rates to combat inflation, risk-free yields increase significantly. Investors can earn attractive guaranteed returns in short-term government paper. Under these conditions, capital frequently flees volatile, non-yielding risk assets (Risk-Off mode).
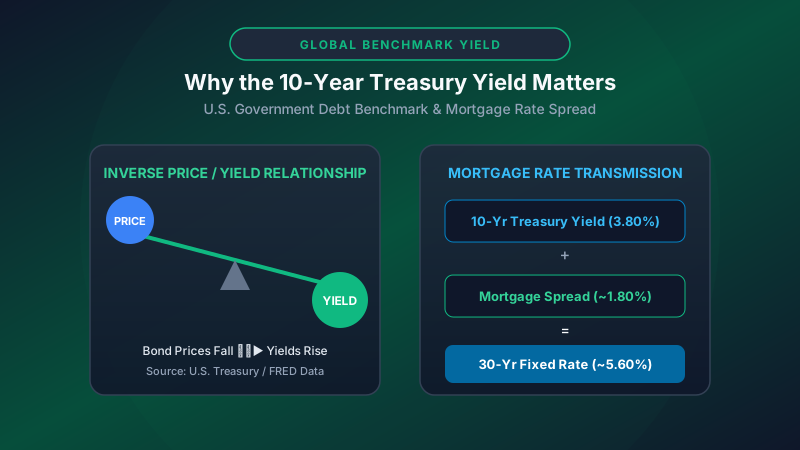
Understanding how interest rate benchmarks function, as detailed in our guide on 10-year treasury yield explained, provides a foundation for analyzing broader market liquidity dynamics.
2. Opportunity Cost and Capital Allocation
Like physical gold, Bitcoin generates no native cash flow, interest yield, or corporate dividends. Its financial return depends entirely on secondary market price appreciation.
When benchmark interest rates rise:
- High Cash Opportunity Cost: Earning 5% guaranteed on liquid cash via high-yield savings accounts raises the hurdle rate for holding volatile assets.
- Leverage Costs Rise: Institutional trading desks and hedge funds frequently use leverage (borrowed capital) to trade digital asset markets. Higher interest rates make borrowing capital significantly more expensive, reducing market leverage and overall trading volume.
3. Institutionalization and Market Correlation
In Bitcoin's early years (2009–2016), its trading volume was dominated by retail participants, and its price movements were largely uncorrelated with traditional financial markets. However, the introduction of regulated futures contracts, institutional custody solutions, and spot exchange-traded products (ETPs) structurally altered market behavior.
Retail Trading Era (Low Macro Correlation) ──► Institutional Adoption Era (High Macro & Tech Stock Correlation)
Increased Correlation With Growth Assets
As traditional asset managers, hedge funds, and corporate treasuries incorporated digital assets into multi-asset portfolios, Bitcoin began trading more like a high-beta technology growth asset. During macroeconomic announcements—such as Federal Reserve rate decisions or Consumer Price Index (CPI) releases—crypto assets frequently move in tandem with technology equity indexes like the Nasdaq-100.
4. Comparing Bitcoin, Physical Gold, and Tech Equities
Market analysts frequently compare Bitcoin against traditional asset classes to evaluate its portfolio behavior:
| Asset Characteristic | Bitcoin (BTC) | Physical Gold | Tech Equities (Nasdaq-100) |
|---|---|---|---|
| Supply Constraint | Programmed 21M Cap | Physical Scarcity | Corporate Share Issuance |
| Yield / Cash Flow | 0% Native Yield | 0% Native Yield | Corporate Earnings & Dividends |
| Macro Rate Sensitivity | High (Liquidity Dependent) | High (Real Rate Dependent) | High (Discount Rate Dependent) |
| Regulatory Framework | Emerging ETP / SEC Oversight | Established Global Commodity | SEC / Public Exchange Rules |
| Price Volatility | Very High | Moderate | Moderate-High |
5. Key Limitations: Why Rates Do Not Solely Determine Crypto Prices
While monetary policy exerts strong cyclical influence, interest rates alone cannot explain or predict Bitcoin price behavior. Digital asset markets are subject to powerful crypto-native structural factors:
| Crypto-Specific Factor | Description | Market Impact |
|---|---|---|
| The Halving Cycle | Programmed 50% reduction in new Bitcoin block rewards every 4 years | Constrains new supply issuance |
| Regulatory Developments | Legislation, exchange approvals, or regulatory enforcement actions | Shifts institutional access & market sentiment |
| Network Security & Adoption | On-chain active addresses, transaction volume, and hash rate growth | Reflects underlying network utility |
| Market Structure Crises | Protocol failures, exchange insolvencies, or stablecoin de-pegging | Triggers rapid crypto-specific liquidations |
Because these internal supply-demand dynamics can override macroeconomic trends, Bitcoin can experience dramatic rallies during high-interest-rate regimes or sharp declines during low-rate environments.
6. Regulatory Disclaimers and Market Safety
Digital assets remain highly volatile financial instruments subject to extreme price fluctuations, regulatory uncertainty, and technical risks.
- No Price Guarantees: Past market performance during rate cycles does not guarantee future results.
- No Centralized Backing: Unlike FDIC-insured bank deposits or government-backed Treasury securities, digital assets carry no sovereign loss guarantees. Review account security principles in our guide on are digital neobanks safe.
- Educational Purpose: Analysis of macroeconomic factors influencing crypto asset prices is strictly educational and does not constitute financial, investment, or trading recommendations.
7. Global M2 Money Supply and Central Bank Balance Sheets
Macroeconomic researchers frequently analyze Bitcoin's price behavior relative to Global M2 Money Supply—a broad measure of liquid money across major central banks (Federal Reserve, European Central Bank, Bank of Japan, and People's Bank of China).
Global M2 Expansion ──► Fiat Purchasing Power Dilution ──► Capital Inflows to Scarcity Assets (Bitcoin & Gold)
- Monetary Expansion Cycles: During periods when global central banks simultaneously expand money supply, Bitcoin has historically experienced upward valuation momentum as global liquidity surges.
- Monetary Contraction Cycles: Conversely, during coordinated quantitative tightening (QT) regimes, global liquid money contracts, reducing speculative risk capital across financial markets.
Evaluating macro liquidity alongside protocol supply dynamics provides a comprehensive framework for observing digital asset market cycles.
8. Historical Cycles and Monetary Policy Shifts
Examining Bitcoin's price trajectory across past market cycles illustrates the interplay between central bank policy shifts and crypto market performance:
- The 2020–2021 Expansion Phase: Following global central bank interest rate cuts to near-zero levels and massive M2 liquidity expansion during the COVID-19 pandemic, Bitcoin experienced a major rally, reaching then-record highs.
- The 2022 Tightening Phase: As the Federal Reserve executed its most rapid rate-hiking cycle in four decades to curb inflation, market liquidity contracted. Risk assets across equity and digital asset markets experienced substantial price drawdowns.
- The 2024–2026 Institutional Maturation Phase: The introduction of spot bitcoin ETPs expanded institutional participation, creating structural liquidity channels that operate alongside macro interest rate cycles.
Recognizing these historical patterns helps investors evaluate crypto market dynamics with realistic risk expectations.
Summary Principles
- Liquidity Sensitivity: Bitcoin prices are responsive to global fiat liquidity trends and central bank benchmark interest rates.
- Opportunity Cost Matters: High risk-free yields on cash assets create headwind pressures for non-yielding volatile assets.
- Multiple Price Drivers: Evaluate crypto markets through a combined lens of macroeconomic policy, regulatory developments, and protocol supply mechanics.
MoneyTalkin' provides financial education, educational concepts, and general informational guides. Articles do not constitute personalized financial, investment, legal, or tax advice. Financial products, rates, terms, and regulatory rules change frequently; consult a qualified financial professional regarding your specific situation. Read our full Disclaimer Policy.
Written by MoneyTalkin'
MoneyTalkin' researches and publishes objective financial education content, money management fundamentals, and practical financial guides.
Related Technical Articles
Explore related topics in this cluster to deepen your understanding.