What Is an Expense Ratio? How Investment Fees Compound Over Time
Understand how mutual fund and ETF expense ratios are deducted from assets and how even small fee differences compound into significant long-term costs.
What Is an Expense Ratio? How Investment Fees Compound Over Time
An expense ratio is an annual management fee charged by mutual funds, index funds, and exchange-traded funds (ETFs) to cover operational expenses, administrative costs, management fees, and marketing. Expressed as a percentage of total assets under management (AUM), the expense ratio is deducted automatically from the fund’s Net Asset Value (NAV) rather than billed separately on investor statements.
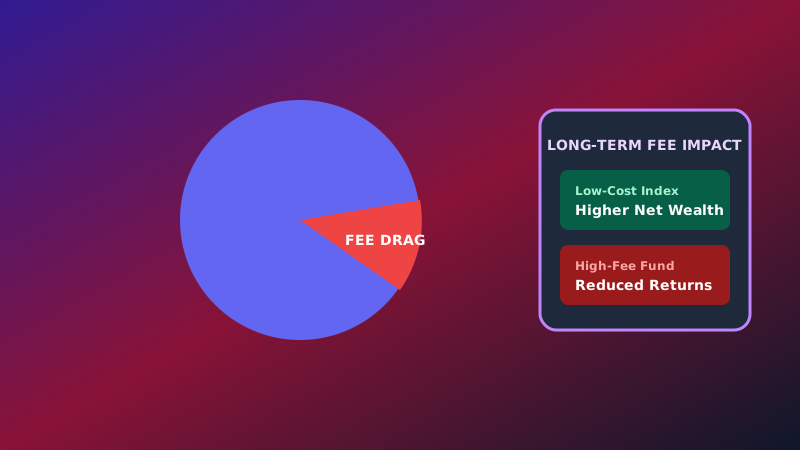
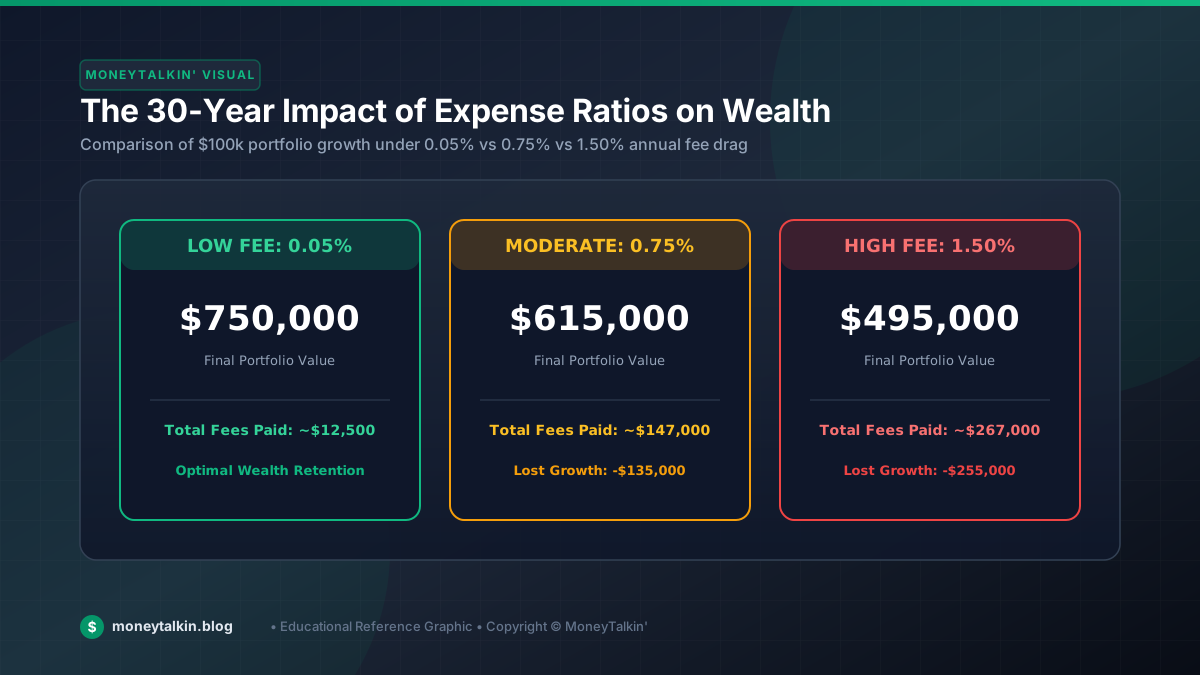
While a 0.50% or 1.00% expense ratio may appear small in isolation, investment fees compound over time. Paying an extra 0.90% annually in fund fees can erode over 20% to 30% of your total potential retirement wealth over a 30-year compounding horizon.
Executive Summary: Expense Ratio Breakdown
- Definition: Annual fund operating cost expressed as a percentage of your total invested portfolio ($\text{Expense Ratio} = \text{Total Fund Expenses} / \text{Average Net Assets}$).
- Deduction Method: Automatically subtracted from daily fund NAV (you do not receive an invoice or statement bill).
- Typical Ranges:
- Broad Market Index Funds / ETFs: 0.02% – 0.08% (Low-Cost)
- Actively Managed Mutual Funds: 0.50% – 1.25%+ (High-Cost)
- Impact: Over 30 years, a 1.00% fee difference can cost an investor tens of thousands of dollars in compounding returns.
How Expense Ratios Are Calculated and Deducted
An expense ratio covers three main internal fund operational costs:
- Management Fees: Compensation paid to portfolio managers and financial analysts.
- Administrative Costs: Custody fees, accounting, legal compliance, and annual reporting.
- 12b-1 Marketing Fees: Promotional and broker distribution fees (common in actively managed mutual funds).
                 NET ASSET VALUE (NAV) DEDUCTION MECHANICS
┌───────────────────────────┐     ┌───────────────────────────┐     ┌───────────────────────────┐
│ Gross Portfolio Return    │  ─  │ Daily Expense Ratio Share │  =  │ Net Portfolio Yield       │
│ (7.00% Annual Growth)     │     │ (0.05% vs. 1.00% Annual)  │     │ Credited to Investor NAV  │
└───────────────────────────┘     └───────────────────────────┘     └───────────────────────────┘
Because the expense ratio is deducted daily from the fund's asset valuation, investors never see a line-item fee charge on their brokerage statements. This stealth deduction leads many investors to underestimate the true cost of high-fee funds.
Step-by-Step Mathematical Comparison: The 30-Year Impact of Fees
To understand the long-term impact of fee drag, consider two investors, Investor A and Investor B, who each invest $100,000 for 30 years in funds achieving identical gross annual returns of 7.00%.
- Investor A (Low-Cost Index Fund): Invests in an S&P 500 ETF with an expense ratio of 0.05% (Net Annual Return = 6.95%).
- Investor B (Actively Managed Mutual Fund): Invests in an active fund with an expense ratio of 0.95% (Net Annual Return = 6.05%).
Mathematical Calculation at Year 30
$$\text{Investor A (0.05% Fee): } $100,000 \times (1 + 0.0695)^{30} = \mathbf{$743,800}$$ $$\text{Investor B (0.95% Fee): } $100,000 \times (1 + 0.0605)^{30} = \mathbf{$574,300}$$
Financial Results Breakdown
| Metric | Investor A (0.05% Fee) | Investor B (0.95% Fee) | Total Fee Impact |
|---|---|---|---|
| Initial Investment | $100,000 | $100,000 | $0 |
| Gross Compound Growth | 7.00% | 7.00% | Identical gross performance |
| Net Portfolio Value at Year 30 | $743,800 | $574,300 | -$169,500 Wealth Loss |
Crucial Takeaway: A seemingly modest 0.90% difference in annual expense ratio cost Investor B $169,500 in lost retirement wealth—amounting to nearly 23% of their total potential nest egg.
Total Cost of Ownership: Beyond the Expense Ratio
While the expense ratio is the primary fund fee, complete fee auditing requires checking:
- Bid-Ask Spread: The execution price difference when trading ETFs on an exchange.
- Sales Loads (Front-End / Back-End): Upfront commissions charged by certain broker-sold mutual funds (e.g., 5.75% front-end load). Always avoid funds with sales loads.
- Account Maintenance Fees: Annual brokerage custody or account inactivity fees.
Practical Takeaway Checklist
- Check the expense ratio (Prospectus Net Expense Ratio) before buying any mutual fund or ETF.
- Target broad market index funds with expense ratios under 0.10%.
- Avoid funds with front-end or back-end sales loads.
- Audit existing 401(k) and IRA holdings to ensure high-fee active funds are replaced with low-cost index alternatives.
Sources
- U.S. Securities and Exchange Commission (SEC Investor.gov): Mutual Fund Fees and Expenses Guide
https://www.investor.gov/introduction-investing/investing-basics/investment-products/mutual-funds-and-etfs/expense-ratios - FINRA: Understanding Mutual Fund Fees
https://www.finra.org/investors/investing/investment-products/mutual-funds
Disclaimer
Educational content only. Past performance does not guarantee future results. Consult a financial professional for individual investment decisions.
Long-Term Impact of Expense Ratios on Compound Wealth
Because expense ratios are deducted directly from fund net asset values daily, even small fee differences compound into massive wealth disparities over multi-decade horizons.
Hypothetical 30-Year Fee Comparison
- Initial Investment: $100,000 | Assumed Gross Annual Return: 8.00% | Investment Horizon: 30 Years
| Investment Fund | Expense Ratio (%) | Final Portfolio Value ($) | Total Lifetime Fees Paid ($) |
|---|---|---|---|
| Low-Cost Index Fund | 0.04% | $995,300 | $10,900 |
| Active Mutual Fund | 0.85% | $785,100 | $221,100 |
In this hypothetical scenario, paying an active fund expense ratio of 0.85% costs the investor $210,200 in lost portfolio value over 30 years compared to a low-cost index fund. Compare options in index fund vs etf explained.
Where to Find Fund Expense Ratio Disclosures
Investors can locate expense ratios on fund fact sheets, brokerage search tables, or the official fund prospectus:
- Gross Expense Ratio: Total annual operating percentage before any temporary fee waivers or expense reimbursements.
- Net Expense Ratio: Actual annual percentage paid by shareholders after accounting for active fee waivers. Always compare Net Expense Ratios when evaluating index funds.
Educational Summary & Key Definitions
Understanding financial fundamentals requires mastering core vocabulary and operational definitions:
- Principal: The original amount of money deposited or borrowed, excluding interest earnings or finance charges.
- Annual Percentage Yield (APY): The real rate of return earned on a deposit account, taking into account the effect of compounding interest over a 12-month period.
- Liquidity: The ease and speed with which an asset can be converted into liquid cash without incurring significant capital loss.
- Diversification: An investment risk management strategy that mixes a wide variety of investments within a portfolio to limit exposure to any single asset class.
Consulting official regulatory guidelines—such as disclosures from the CFPB, FDIC, NCUA, and Federal Reserve—ensures you make informed financial decisions backed by verified consumer protections.
MoneyTalkin' provides financial education, educational concepts, and general informational guides. Articles do not constitute personalized financial, investment, legal, or tax advice. Financial products, rates, terms, and regulatory rules change frequently; consult a qualified financial professional regarding your specific situation. Read our full Disclaimer Policy.
Written by MoneyTalkin'
MoneyTalkin' researches and publishes objective financial education content, money management fundamentals, and practical financial guides.
Related Technical Articles
Explore related topics in this cluster to deepen your understanding.